This printout provides a graph that highlights the cost of non-compliance deriving from the recording of costs for activities attributable to a non-compliance (see specific page).
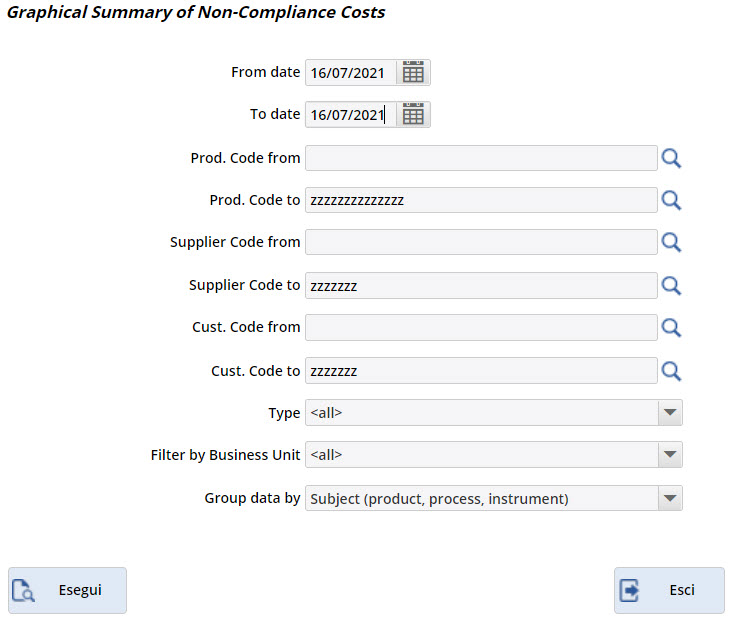
- Fill out the fields From date/To date, according to the period of interest.
- If you want to further filter the print, fill in the fields:
- Prod. code from/Prod. code to
- Supplier code from/Supplier code to
- Cust. code from/Cust. code to
- To open the respective registry, click on the magnifying glass.
- You can then choose a Type, including:
- By acceptance
- By process
- From final testing
- Complaint reviews
- From assistance
- N.c. from system
- N.c. from tools/equipment
- N.c. from report/complaint
- N.c. from project/contract
- A Filter by Business Unit can also be set.
- You can modify the data of the x-axis of the chart, click in the field Group data by between:
- Object (product, process, instrument),
- Customer
- Supplier
The Esegui button allows you to preview the requested print; from the preview window it will then be possible to print.
The Esci button closes the form.