This printout provides a graph that highlights the number of reports-complaints in relation to their origin.
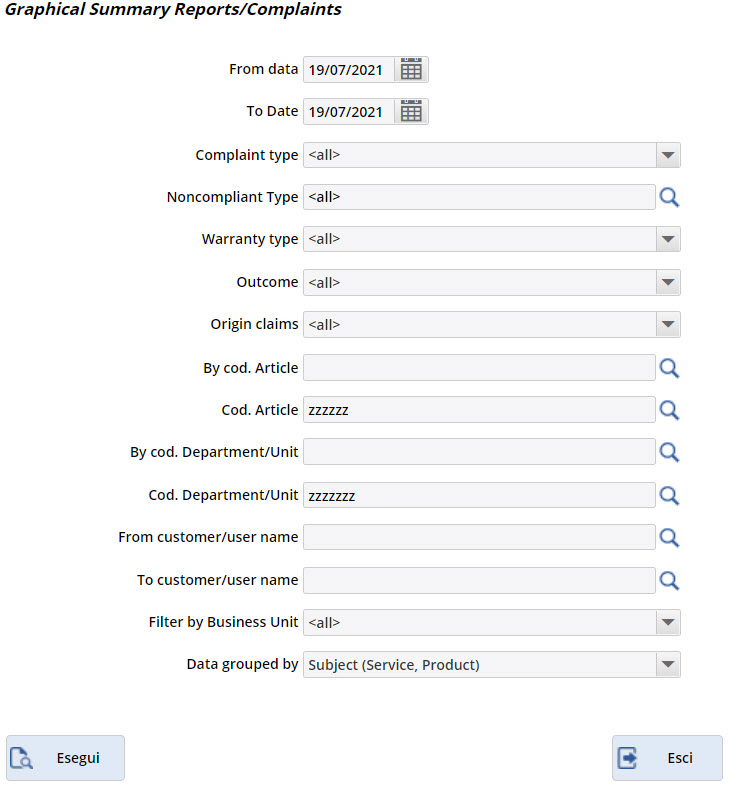
- Fill out the fields From date/To date, according to the period of interest.
- You can filter the complaints to:
- Complaint type
- Noncomplaint type
- Warranty type
- Outcome
- Origin claims: you can choose between Email, Fax, Ordinary mail, Customer return, Phone call, Web.
- If you want to further filter the print, fill in the fields:
- By cod. Article/Cod. Article
- By cod. Department/Unit/Cod. Department/Unit
- From customer/user name/To customer/user name
- A Filter by Business Unit can also be set.
- You can modify the data of the x-axis of the chart, click in the field Data grouped by between:
- Subject (Service/Product)
- Department/Unit
- Customer/User name
- Reporting tipology
- Warranty type
- Nonconformity type
The Esegui button allows you to preview the requested print; from the preview window it will then be possible to print.
The Esci button closes the form.