This form provides a chart showing the amount of the non conformity compared to another data as it could be:
- the object (product, process, instrument),
- the responsible supplier,
- the customer who has made the claim,
- the type of Non-conformity.
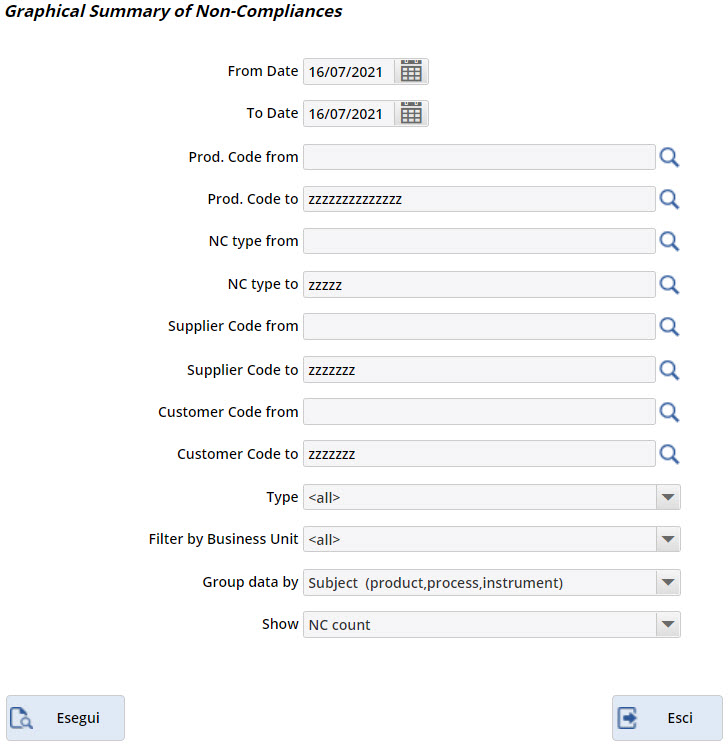
- Fill out the fields From Date/To date, according to the interested period
- If you want to further filter the print, fill in the fields:
- Prod. code from/Prod. code to
- N.C. type from/N.C. type to
- Supplier code from/Supplier code to
- Customer code from/Customer code to
- To open the respective registry, click on the magnifying glass.
- You can then choose a Type, including:
- By acceptance
- By process
- From final testing
- Conformity reviews
- From assistance
- N.c. from system
- N.c. from tools/equipment
- N.c. from report/complaint
- N.c. from project/contract
- A Filter by Business Unit can also be set.
- You can modify the data of the x-axis of the chart, click in the field Group data by between:
- Object (product, process, instrument),
- Responsible supplier
- Customer
- NC Type
- In Show you can choose to display on printing the N.C. Count or the Sum of quantities.
The Esegui button allows you to preview the requested print; from the preview window it will then be possible to print.
The Esci button closes the form.