Pareto chart shows the frequency with which manifest the non-conformities found in Quality System as a whole,not referable to a control on the product.
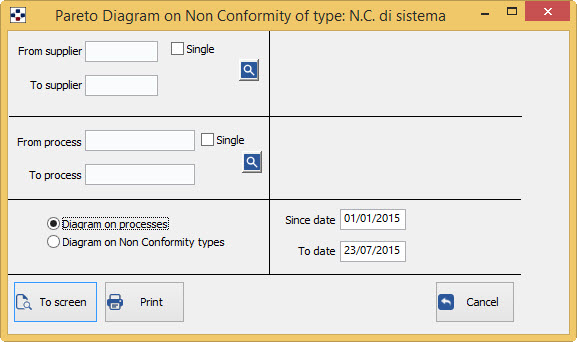
In particular, it is possible to have two types of graphs, using the option “Diagr. on processess/Diagr. N.C. types”:
- Selecting Diagram on processes you will get the diagram that shows for each article the frequency with which manifest non-conformity.
- Selecting instead Diagram on the types of non-conformity you will get the diagram about the percentage frequency for each type of non-conformity.
- Fill in the fields From supplier/to supplier, depending on the data that interest you:
- to get the Non-conformities relating to all suppliers of the company, do not specify any code in the two fields.
- instead specify two different codes, to get the Non-conformities regarding the suppliers within the range specified.
- If you do not specify the code first, then print the Non-conformities for suppliers starting from the first of the archive, up to the value specified in the second field; Conversely, specifying the first field and not the second, will print the Non-conformities from supplier with specified code, until the end of the archive.
- If you want the Non-conformity of a particular supplier, just specify the required code in the first field and tick“single” .
- The <F2> button or the
 button open the General list of suppliers.
 - Fill in the fields From process/to process, depending on the data that interest you:
- to get the Non-conformity regarding all business processes, do not specify any code in the two fields.
- instead specify two different codes, to get the Non-conformities regarding the processes within the range specified.
- If you do not specify the code first, it will print the processes Non-conformity from the first archive, up to the value specified in the second field; Conversely, specifying the first field and not the second, will print the processes Nonconformity that start with the specified code, until the end of the archive.
- If you want a given process (N.C), just specify the required code in the first field and tick “single”.
- If you require the diagram on the types of non-compliance will make a further choice: “From N.C. code/To N.C. code”
- to get listed in the diagram all Non-conformity indifferently of their code, do not specify any code in the two fields.)
- instead specify two different codes, to get the Non-compliance with the code within the range you specify.
- If you do not specify the code first, then print the Non-conformities from the first archive code, up to the value specified in the second field; Conversely, specifying the first field and not the second, will print the Non-conformities from specified code, until the end of the archive.
- If you want to restrict printing to a Non-conformity, only put in both fields the same code.
- The <F2> button or the button open the General list of non-conformities codified.
5. Fill out the fields since date/to date, according to the desired period:
- if you no change the date of the two fields, you’ll get the data prints from 1 January of the current year, until today.
- if you write a date in both fields, you will have the information relative to the specified time span.
The button “video” displays print preview request; from the preview window you can then print.
The button “print” printing request.
The button “Cancel” cancels the print request and leaves the Board.
As for the buttons on the print preview window, see the section on.